
|
Rheology - A Practical Approach to Quality Control |
| Mark
C. Edwards Gammadot Rheology Testing & Consultancy Services |
INTRODUCTION With
ever increasing costs of raw feedstock and processors under pressure to
use more recycled materials in product manufacture, the importance of
controlling & optimising today’s production processes is paramount.
Key to minimising component reject rates is guaranteeing consistent material
batches enter the production stream, and ensuring these materials aren’t
subjected to excessive processing history. Rheological measurements are
fast, versatile methods of ensuring the correct generic type and grade
of material has been supplied by the distributor, and that during conversion,
it is being processed in an optimal manner. |

| Why rheology? The short, simple answer is, as always, to save money. But again, why rheology? The controlling factor in all polymer conversion processes is the material's rheological behaviour - if you can't deform & make the material flow, you can't process it! The rheological behaviour of a polymer melt is highly sensitive to material structure. Rheological measurements can detect even the most discrete of changes in structural properties, and are therefore fast & accurate methods of providing quality control for all aspects of the process. Whether it be screening incoming raw materials to discriminate batch to batch variance, avoiding extrusion problems such as melt fracture by mapping the critical shear stresses at which the phenomena occurs, or determining thermal degradation in failed components caused by inadequate drying of material / excessive thermal history within the process, rheometry can provide this information in a fast & reproducible manner. Rheometry equipment & staff training can be prohibitively expensive to the smaller company but, for minimal outlay, outsourcing quality control testing to an external laboratory can provide a cost effective alternative. More importantly, with a proven quality control system in place the risks of expensive component reject rates or worst, failure in service leading to product recall are minimalised. Rheological measurements are excellent at: |
|

|
|
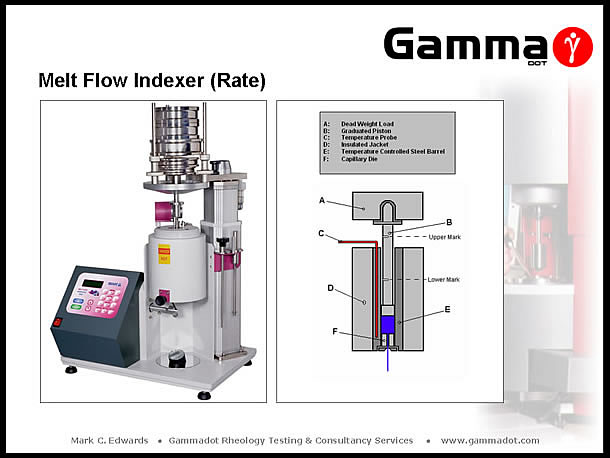
The Melt Flow Index or latterly known as the Melt Flow Rate (or Melt Volume Rate), is one of the industries oldest, and widely used rheological quality control tools. It has been around for decades and comes in may shapes & configurations, although all are basically a crude form of capillary rheometer. The MFI value quoted for a particular material is an average weight of material "cut offs" collected at set time intervals under isothermal constant load extrusion. The procedure requires the material to be loaded and melted for a specific timescale (usually ~4 minutes) prior to a dead weight load being applied. The material is allowed to extrude freely until the lower mark on the piston reaches the entrance of the barrel. At this point the extrudate is cut cleanly from the capillary die exit and a timing device started simultaneously. At set time intervals lengths of extrudate are cut and collected until the upper mark on the piston reaches the barrel entrance, at which point collection ceases. A minimum three lengths of cleanly cut, air bubble-free extrudate are required for calculations. These are weighed to the nearest milligram and the weights recorded. The average weight of extruded samples is then calculated. Unfortunately, because the MFI is a low shear, single point test, it is woefully inadequate at providing the full picture in relation to process-range data. Due to the pseudoplastic (shear thinning) behaviour of polymer melts it is important to determine the magnitude of viscosity across as wide a shear rate range as possible, as the material will experience changes in flow geometries and hence shear rate during the process. Taking a typical Polypropylene having a MFI value of 2.4 g/10 mins (determined using a 2.16 kg applied mass @ 230°C), assuming the density is known, an approximate shear rate of 6.7 1/s can be calculated [Ref.1]. (It is an approximation because of the fact that MFI is driven by constant stress and not rate controlled; there is an increase in velocity as the MFI barrel empties under the constant applied stress (load)). As typical polymer processing techniques involve shear rates of ~100 1/s up to 100,000 1/s it can be seen that the MFI is a poor representation of the process, as it is unable to compare polymer flow behaviour at the shear rate levels experienced during conversion. |
|
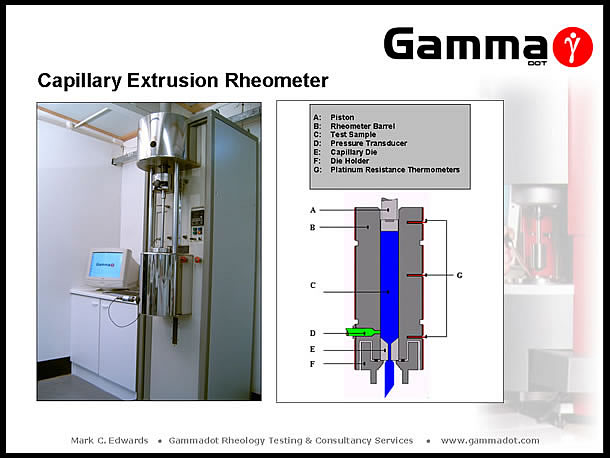
The capillary rheometer is one of the two most popular research level rheometers in use today. A capillary rheometer is in essence, a highly instrumented ram extruder with extremely accurate ram speed & temperature control, pressure drop measurement and capillary die geometries. A capillary rheometer is the instrument of choice when viscometry measurements are required across shear / extensional rate ranges relative to polymer processing. The rheometer is capable of measuring viscosity data at shear rates in excess of 250,000 1/s and can generate data at temperatures up to 400°C and pressures of 30000 psi. In addition to providing the required viscosity data for applications such as injection moulding / extrusion flow simulation, capillary rheometry is ideal for discriminating processing problems such as melt fracture / shark skinning, die swell, and slippage flow. A charge of polymer is compressed and melted within the rheometer barrel. Once the material reaches thermal equilibrium, it is extruded at accurately controlled ram speeds through a capillary die manufactured with extremely high tolerances, (length & internal diameter). The pressure generated at the die is measured by a pressure transducer situated immediately above the die entrance. The capillary die diameter controls the magnitude of apparent shear rate (doubling the diameter reduces the shear rate by a factor of 8), and the length controls the apparent shear stress (doubling the length halves the shear stress). The total pressure drop through a capillary die is a combination of the pressure drop along the die land and errors relating to entrance & exit effects. To correct these errors, measurements are made in duplicate with dies of the same diameter but different lengths, a 'long' (20:1mm) die & 'short' (1:1mm) die. The 'short' die pressure drop is used to correct the errors generated with the 'long' die - the resultant corrected pressure drop relating to steady state flow within the die land only. This is known as the Bagley end correction. Although the capillary rheometer is excellent for providing shear and extensional viscosity data across a wide range of shear & extension rates the main factor impeding it's popularity is cost - the instrument is relatively very expensive (in the range 40k - 60k for a full sized floor mounted rheometer). A wide range of pressure transducers & dies are ideally needed to characterise different materials (viscous polymers tend to require use of a 0 - 30,000 psi pressure transducer (long die) & anything between a 0 - 5,000 to 0 - 15,000 psi transducer (short die), whereas low viscosity samples would use a 0 - 3,000 psi to 0 - 15,000 psi transducer (long die), and a 0 - 500 to 0 - 1,500 psi (short die) - ideally 5 - 7 different range transducers are needed to cover a full range of materials and with the cost of a transducer ~£600+ each this adds a few thousand to the price. A wide range of materials can be tested using 1mm diameter dies but in instances where the material is highly filled, extremely viscous or simply a much lower shear rate range is required, 2mm & 4mm dies are required - further expense. Another draw back of capillary rheometry is sample volume - a single bore rheometer with a 20mm diameter barrel requires almost 0.25kg of material to provide bagley corrected data at one temperature. The material must also be in a form ready able to load the instrument with i.e. pellet form or strip - a problem for instance when wanting to compare the rheological behaviour of 'good' & 'bad' samples as part of a failure analysis project where only moulded product is available. It is also impossible to measure very low viscosity samples or fluids due to material loss through the die under gravity. |
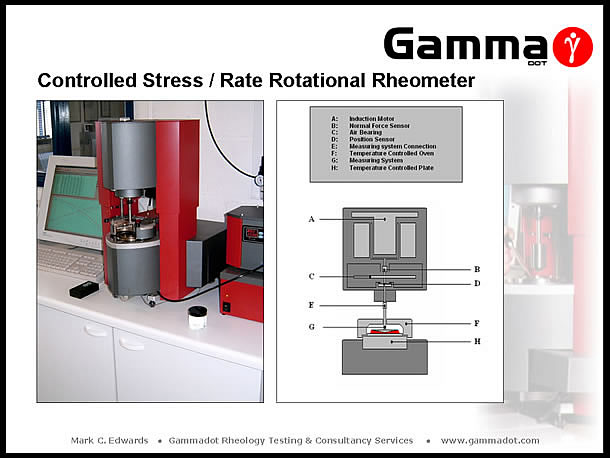
No quality control laboratory should be without access to a high resolution controlled stress rotational rheometer. This type of rheometer is an extremely sensitive, yet robust bench top instrument which is available in a number of machine configurations. The measurement system of the instrument is modular and therefore a wide range of test parameters can be derived in conjunction with the use of either plate / plate, cone & plate or coaxial cylinder systems. Measurement geometries are connected to a spindle which is driven via a non contact induction motor. The drive system is supported by a high quality porous carbon air bearing which results in virtually frictionless movement of the measurement system. Angular deflection is detected via a low inertia optical encoder to high accuracy. The instrument can be also be run in constant rotation mode or oscillation (the mode which this paper will focus on). This results in unparalleled sensitivity to changes in material structure such as chain scission or cross linking, plus in addition to shear & complex viscosity data, many other material parameters can be derived such as loss and storage modulus, phase angle, yield stress, creep & creep recovery. Running the instrument as a function of temperature in fixed oscillation enables information on phase changes such glass transition (Tg) & crystalline melt point (Tm) to be derived. Another major advantage of the rotational rheometer is sample size - a standard 40mm plate / plate system run with a 1mm gap only requires a few grammes of sample and it can be in the form of granules or a section of moulded product - the heated upper plate is lowered onto the sample which melts and exudes excess material from the periphery of the plate until it reaches the set gap size, (whereupon excess sample is removed prior to testing). This makes the instrument perfect for supporting failure analysis as samples can range from virgin granules to sections removed from 'good' moulded components & failed components. No rheometer is perfect and the main draw backs related to the rotational rheometer are price (albeit no where near the cost of a capillary rheometer, a rotational instrument can still be in the range of £20k - £30k). The fact that very high shear rates are difficult to achieve in rotational measurements due to interfacial slippage and loss of material at the plate periphery due to centrifugal forces, at high rotational speeds. Extensional viscosity data cannot be derived from a rotational rheometer, (although the National Physical Laboratory is currently investigating the feasibility of further development of the kit to provide extensional data in the future) - saying this, a comparative indication can be gleaned by comparing sample loss / storage modulus curve cross-over point positions on the modulus axis, (see slide 11 further down). |
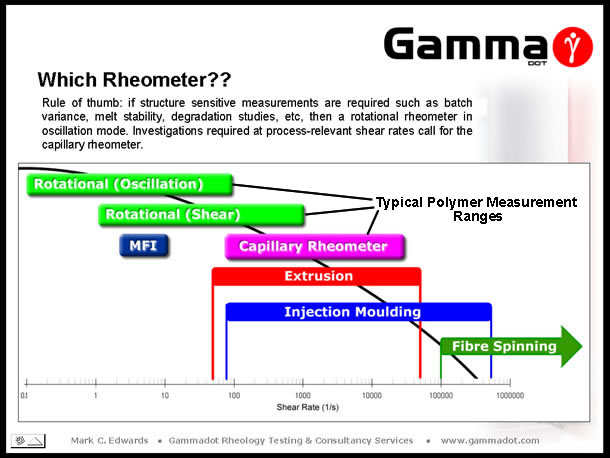
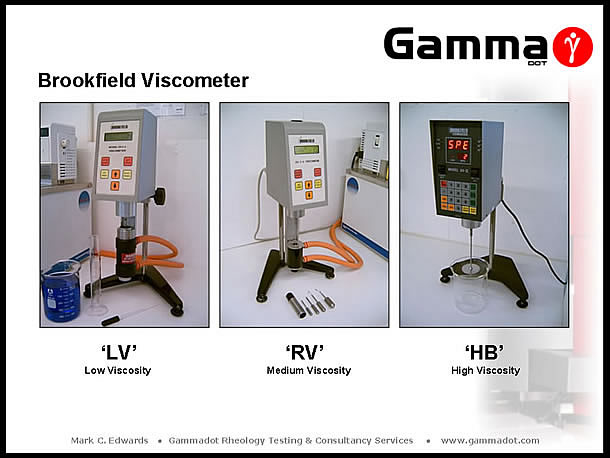
So, we've looked at four instruments commonly found in today's quality control laboratories, but which instrument is best for your project? My rule of thumb is simple: MFR and Brookfield measurements are only really useful if they are the only data you have to compare against or if a specific historical standard has to be adhered to. If process relevant high shear viscosity and/or extensional viscosity data is required then use a capillary rheometer. If analysis sensitive to structural changes are required such as batch to batch variance, melt stability, thermal degradation studies then a rotational rheometer in oscillation mode is the correct choice. For the rest of this talk, I'm going to focus on the versatility of oscillatory rheometry for material characterisation & investigation. |
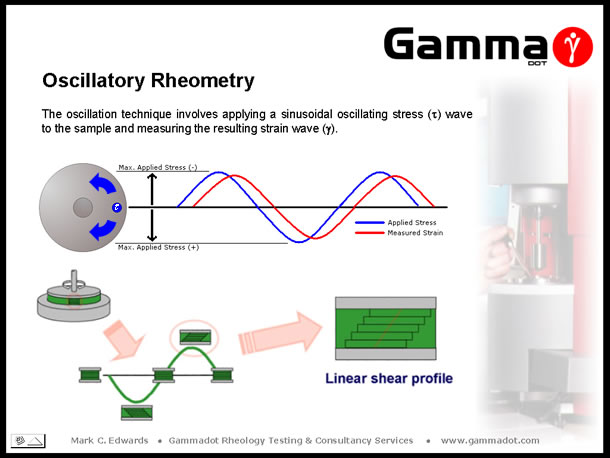
Oscillatory measurements involve the application of a sinusoidal stress wave to a sample, at controlled amplitude & frequency and measuring the resultant strain wave response. The above slide visually demonstrates this - the sample is sandwiched between a fixed base plate & an upper oscillating plate. Imagine the 'blue dot' on the overhead view of the upper plate was the tip of a clock hour hand at the 3 O'clock position - swinging the arm backwards & forwards between the 2 O'clock and 4 O'clock positions could be described as a low amplitude oscillation whereas swinging the arm between the 12 O'clock and 6 O'clock positions could be described as large amplitude oscillation. Frequency simply being the speed of cycling between the positions (i.e. 10 Hz = 10 cycles per second). |
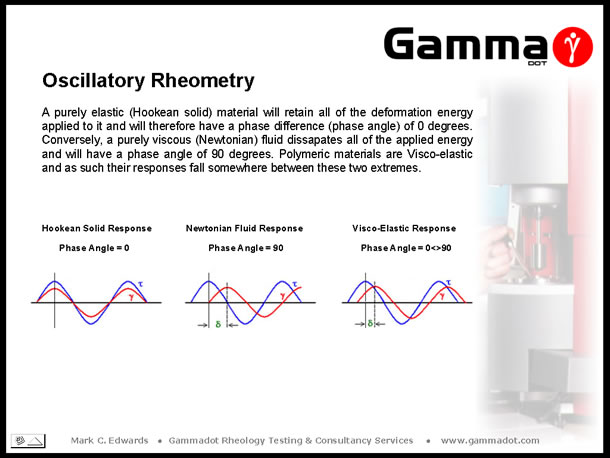
The relationship of the applied stress wave to the resultant strain wave is described by the phase angle (d). A purely elastic (Hookean solid) material retains all of the applied stress resulting in a completely in-phase strain response, i.e. the phase difference (phase angle) is zero degrees. A purely viscous (Newtonian) fluid will dissipate all of the applied stress resulting in a completely out of phase signal, giving a phase angle of ninety degrees. As polymers tend to be visco-elastic, their response to oscillatory deformation will vary between 0° and 90° depending on the frequency - under high frequency deformation (short relaxation times), elastic behaviour tends to dominate, whereas low frequency deformation (long relaxation times), gives a more viscous response. |
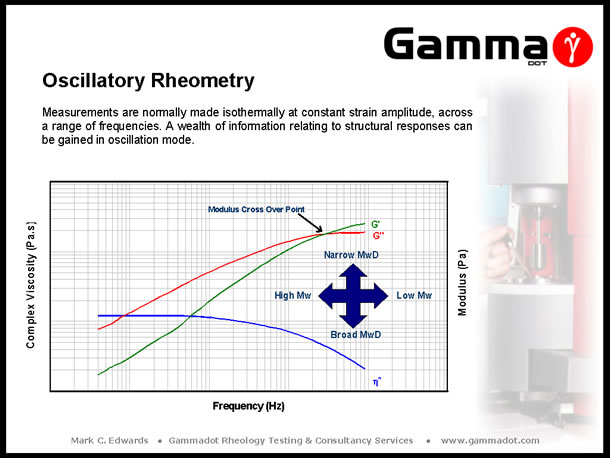
Making isothermal measurements over a range of frequencies can give a valuable insight into a polymers' structure through the study of the resultant rheological responses. Data of most interest derived from a frequency sweep are Complex Viscosity (h*), Storage and Loss modulus (G' & G"), and Phase angle (°). The limiting (plateau) viscosity reached at low frequency is indicative of a material's zero shear viscosity and therefore it's molecular weight. The point at which the G' & G" curves cross over is an excellent indicator of magnitudes of average molecular weight and molecular weight distribution when comparing samples - the lower down the frequency range the curves cross, the higher the average molecular weight and the position of the cross-over on the modulus axis gives an indication of molecular weight distribution (increased modulus = narrower Molecular weight distribution). Phase angle or Tan Delta (the tangent of the phase angle) is related to, and is an indicator of magnitudes of elasticity. With this knowledge in mind, it is possible to “fingerprint” material structural properties and predict the causes of variation in compared samples. For example, if a material has experienced chain scission through poor processing (inadequate drying, thermal degradation during conversion, etc), this will show up as a decrease in the overall complex viscosity response, an increased phase angle, and a relative shift to the right of the modulus cross-over point on the frequency axis. Conversely, the opposite occurs in the case of structural changes due to cross linking, (increased viscosity, decreased phase angle & modulus cross-over point shifted to the left on the frequency axis). |
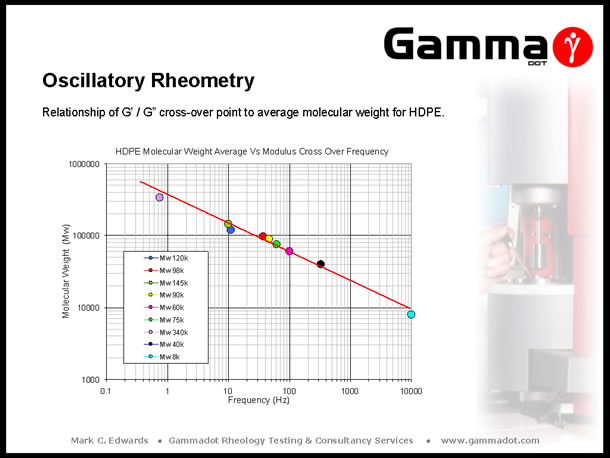
The above slide relates to project work carried out on a number of commercial grades of high density Polyethylene, (HDPE). As part of the project, each of the grades were fully characterised for rheological, thermal & physical properties including measurement of average molecular weight (Mw) via Gel Permeation Chromatography, (GPC). As the G' / G" cross-over point is a good indicator of changes in Mw, it was decided to plot the cross-over values of each of the grades against the actual value of measured Mw to study the relationship. Interestingly, the plot gives a virtually linear response across the nine grades which represented the range of Mw commercially available - thus giving a useful 'look up' chart to compare future HDPE rheological measurements against to provide an indication of magnitude of Mw. |
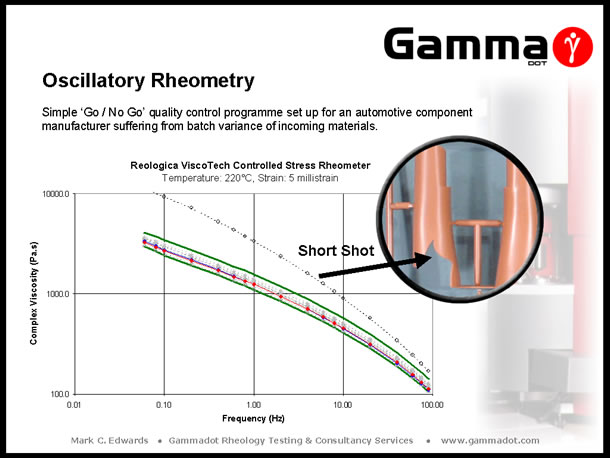
Controlling quality of incoming batches of material is critical to maintaining an optimised conversion process and minimising reject rates. The above slide demonstrates a simple 'Go / No Go' quality control programme set up for an automotive components moulder who operated a 'just in time' manufacturing regime. The company had been experiencing problems with variation in the properties of supplied batches of Polypropylene, evident in fluctuating levels of product reject rates - which threatened planned delivery schedules. By characterising samples taken from 'Good' & 'Bad' batches of material a simple 'process window' (the limits of which are indicated by the green curves on the graph), was compiled against which future batches could be compared - enabling any incoming materials that fell outside of the window to be rejected before entering the production line. |
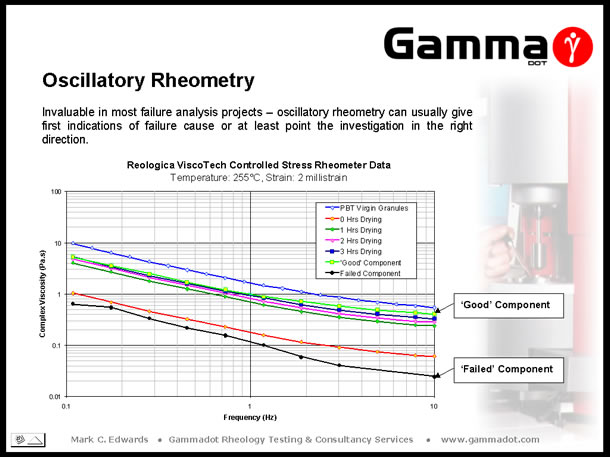
Another extremely useful application of oscillatory rheometry is the support of failure analysis projects. The above slide displays data produced as part of one such project, carried out for an electrical connectors manufacturer. Problems arose with a particular product which had a brass fitting pressed into a central boss within the moulding. This product was sourced from two different manufacturing facilities - one in Bulgaria which produced mouldings with no problems and one in Poland which was producing components that cracked upon pressing the brass insert into position. The connector was moulded out of a glass-filled PolyButylene Terephthalate (PBT) grade, a semi-crystalline, hygroscopic (moisture sensitive) material. Sections removed from both 'good' and failed components were rheologically characterised and it could be seen there was almost a full (log) decade drop in complex viscosity across the measured frequency range between the samples. This considerable decrease indicated there had been a sharp reduction in molecular weight due to degradation - chain scission probably being a result of inadequate pre-process drying. To confirm this theory, test specimens were injection moulded after zero, one, two & three hours drying in a vacuum oven @ a temperature of 135°C. Sections of the dried mouldings and virgin granules were measured and it could be seen that the viscosity response of the undried (zero hours) moulding lays closest to the failed sample's viscosity curve. As predicted, as drying time was increased the level of degradation decreased demonstrated by an increased retention of properties. At the optimised drying time for PBT of 3 hours @ 135°C it could be seen the viscosity had risen to a level comparable to that of the 'good' sample although interestingly, after only one hours drying properties increase to similar level. |
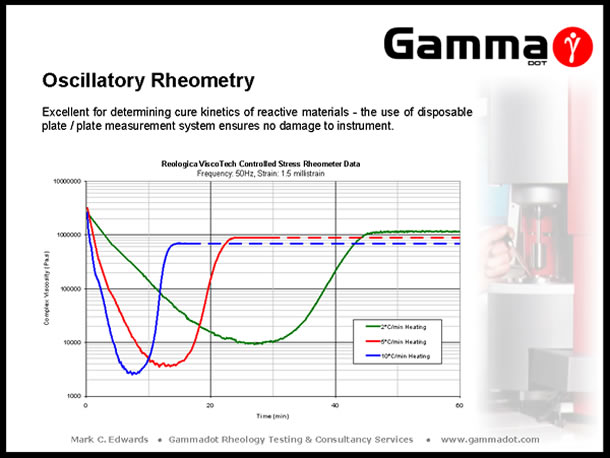
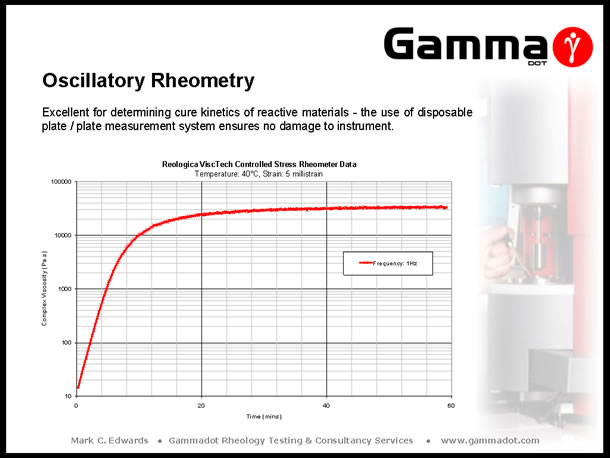
A controlled stress rheometer in oscillation mode is the only instrument covered in this talk which is able to characterise thermosetting materials. As previously mentioned, the measurement system is modular therefore allowing the use of a disposable plate / plate system. Measurements are usually carried out isothermally at fixed strain & frequency as a function time (Isothermal cure), or fixed strain & frequency as a function of temperature, (reactive viscosity measurements). The plot above depicts the viscosity response of an Epoxy moulding compound as a function of different heating rates. Running as a function of temperature in cooling mode is also excellent at determining phase transitions in hot melt adhesives and investigating the effect of changing ingredient ratios in compound trials. The plot below displays the isothermal cure characteristics of a two part Epoxy adhesive. |
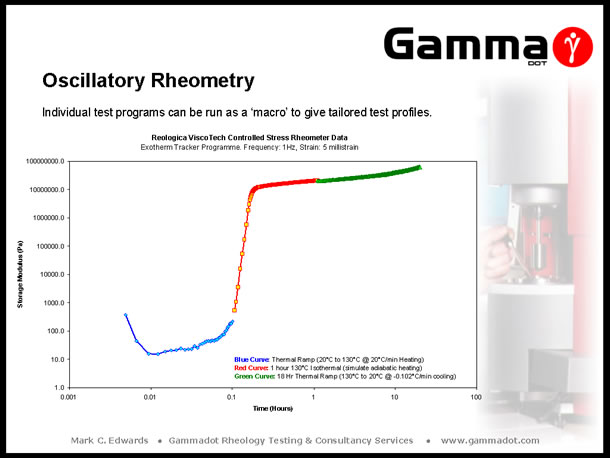
Control software for modern rotational rheometers are exceptionally versatile. A useful function of software is the ability to 'string' individual test programmes into a project 'macro'. The slide below is an example of this. A manufacturer of products for the offshore oil industry was encapsulating components in a large volume of Polyurethane, for use in offshore applications. The cured resin was required to reach a specific modulus to ensure integrity of the moulding at the pressures experienced in deep sea conditions. Full cure of the moulding was not reached until almost 24 hours after mixing and casting, and the cure kinetics passed through three distinct phases: an initial exothermic reaction which raised the temperature of the casting from 20°C to 130°C, an hour at a constant 130°C (a result of adiabatic heating), followed by an 18 hour slow cooling phase. This was easily replicated by using three test templates joined together in a project macro. All templates used the same fixed frequency & strain amplitude with the first programme running a heating ramp from 20°C to 130°C @ a heating rate of 20°C/min (to replicate the initial exothermic reaction). The second programme was an isothermal measurement @ 130°C for one hour, (simulating adiabatic heating conditions), and the third programme an extremely slow cooling ramp from 130°C to 20°C over 18 hours (-0.102°C/min). |
The previous slides have shown that rheological techniques can be fast, versatile methods of providing support for a whole range of applications from product design to failure analysis. It is unfortunate in this day and age that many companies are still ignorant to the importance of rheology in the conversion processes they work with, therefore I hope this presentation has given an brief insight into the subjects' usefulness as a flexible quality control tool. |

|
References [1] Fleming,
D.J, Melt Fracture and Elongational Viscosity via Convergent Flow Analysis
, Proceedings of Polymer Testing '96 , RAPRA (1996). |